DekGenius.com
[ Team LiB ] Previous Section Next Section

Recipe 12.6 Send Access Data to Excel and Create an Excel Chart

12.6.1 Problem

You want to export data from Access to Excel and create a chart programmatically.

12.6.2 Solution

You can use an ADO Recordset object to export data to Excel programmatically, then use Automation with Excel to create a chart based on the exported data.

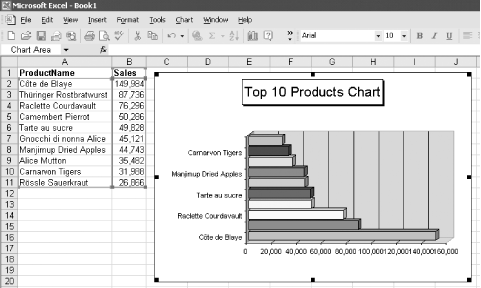
Load and run frmExcel from 12-06.MDB. This form calls out to Excel, passing in the values from a recordset to create an Excel spreadsheet and chart based on sales data from the Northwind sample database (see Figure 12-9).

Figure 12-9. The finished Excel worksheet and chart
figs/acb2_1209.gif

Here's how you can create Excel charts in your own Access applications:

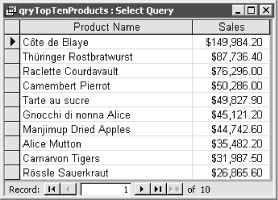
  1. Create the query that will hold your data. In the sample database, you'll find qryTopTenProducts, which calculates the top 10 products by dollar amount sold. There are two columns: the product name and the total dollar amount. The datasheet view of the query is shown in Figure 12-10.

Figure 12-10. qryTopTenProducts in datasheet view
figs/acb2_1210.gif
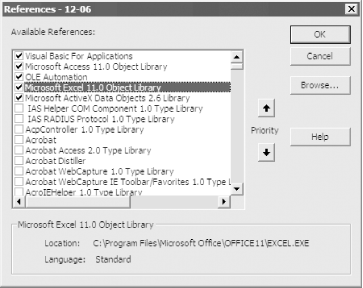
  1. Set a reference in your project to the Microsoft Excel object library and the ADO library, as shown in Figure 12-11.

Figure 12-11. References needed to make the code work
figs/acb2_1211.gif
  1. Create the procedure that exports the data to Excel and creates a sample chart. Here's the complete listing:

    Private Const conQuery = "qryTopTenProducts"
    Private Const conSheetName = "Top 10 Products"
    
    Public Sub CreateExcelChart( )
    
        Dim rst As ADODB.Recordset
        
        ' Excel object variables
        Dim xlApp As Excel.Application
        Dim xlBook As Excel.Workbook
        Dim xlSheet As Excel.Worksheet
        Dim xlChart As Excel.Chart
        
        Dim i As Integer
        
        On Error GoTo HandleErr
        
        ' Create Excel Application object.
        Set xlApp = New Excel.Application
        
        ' Create a new workbook.
        Set xlBook = xlApp.Workbooks.Add
        
        ' Get rid of all but one worksheet.
        xlApp.DisplayAlerts = False
        For i = xlBook.Worksheets.Count To 2 Step -1
            xlBook.Worksheets(i).Delete
        Next i
        xlApp.DisplayAlerts = True
        
        ' Capture reference to first worksheet.
        Set xlSheet = xlBook.ActiveSheet
        
        ' Change the worksheet name.
        xlSheet.Name = conSheetName
        
        ' Create recordset.
        Set rst = New ADODB.Recordset
        rst.Open _
         Source:=conQuery, _
         ActiveConnection:=CurrentProject.Connection
        
        With xlSheet
            ' Copy field names to Excel.
            ' Bold the column headings.
            With .Cells(1, 1)
                .Value = rst.Fields(0).Name
                .Font.Bold = True
            End With
            With .Cells(1, 2)
                .Value = rst.Fields(1).Name
                .Font.Bold = True
            End With
        
            ' Copy all the data from the recordset
            ' into the spreadsheet.
            .Range("A2").CopyFromRecordset rst
         
            ' Format the data.
            .Columns(1).AutoFit
            With .Columns(2)
                .NumberFormat = "#,##0"
                .AutoFit
            End With
        End With
        
        ' Create the chart.
        Set xlChart = xlApp.Charts.Add
        With xlChart
            .ChartType = xl3DBarClustered
            .SetSourceData xlSheet.Cells(1, 1).CurrentRegion
            .PlotBy = xlColumns
            .Location _
             Where:=xlLocationAsObject, _
             Name:=conSheetName
        End With
        
        ' Setting the location loses the reference, so you
        ' must retrieve a new reference to the chart.
        With xlBook.ActiveChart
            .HasTitle = True
            .HasLegend = False
            With .ChartTitle
                .Characters.Text = conSheetName & " Chart"
                .Font.Size = 16
                .Shadow = True
                .Border.LineStyle = xlSolid
            End With
            With .ChartGroups(1)
                .GapWidth = 20
                .VaryByCategories = True
            End With
            .Axes(xlCategory).TickLabels.Font.Size = 8
            .Axes(xlCategoryScale).TickLabels.Font.Size = 8
         End With
        
        ' Display the Excel chart.
        xlApp.Visible = True
    
    ExitHere:
        On Error Resume Next
        ' Clean up.
        rst.Close
        Set rst = Nothing
        Set xlSheet = Nothing
        Set xlBook = Nothing
        Set xlApp = Nothing
        Exit Sub
        
    HandleErr:
        MsgBox Err & ": " & Err.Description, , "Error in CreateExcelChart"
        Resume ExitHere
    End Sub

12.6.3 Discussion

Two constants are declared in this procedure—one for the name of the query used to export data, and one for the name of the worksheet in Excel:

Private Const conQuery = "qryTopTenProducts"
Private Const conSheetName = "Top 10 Products"

You need to declare an ADO Recordset variable as well as Excel Application, Workbook, Worksheet, and Chart object variables:

Dim rst As ADODB.Recordset

' Excel object variables
Dim xlApp As Excel.Application
Dim xlBook As Excel.Workbook
Dim xlSheet As Excel.Worksheet
Dim xlChart As Excel.Chart

Dim i As Integer

The Application object variable is needed to launch Excel; the Workbook variable is needed to create a new workbook; the Worksheet variable is needed to work with the worksheet when exporting the data; and the Chart variable is needed for creating and manipulating the chart.

The first section of code launches Excel, creates a new workbook, removes all but one worksheet, and renames the worksheet:

Set xlApp = New Excel.Application
Set xlBook = xlApp.Workbooks.Add
xlApp.DisplayAlerts = False
For i = xlBook.Worksheets.Count To 2 Step -1
    xlBook.Worksheets(i).Delete
Next i
xlApp.DisplayAlerts = True
Set xlSheet = xlBook.ActiveSheet
xlSheet.Name = conSheetName

Next, the ADO recordset is created based on the saved query:

Set rst = New ADODB.Recordset
rst.Open _
 Source:=conQuery, _
 ActiveConnection:=CurrentProject.Connection

Once the recordset is opened, the field names are copied into the Excel worksheet and formatted:

With xlSheet
    With .Cells(1, 1)
        .Value = rst.Fields(0).Name
        .Font.Bold = True
    End With
    With .Cells(1, 2)
        .Value = rst.Fields(1).Name
        .Font.Bold = True
    End With

Only a single line of code is needed to copy the data from the ADO recordset to the Excel worksheet:

.Range("A2").CopyFromRecordset rst

Next, the columns are formatted one at a time, using Autofit to size the rows to the widest entry, and assigning a number format to the second column:

    .Columns(1).AutoFit
    With .Columns(2)
        .NumberFormat = "#,##0"
        .AutoFit
    End With
End With

The chart is then created and formatted using the Chart object:

Set xlChart = xlApp.Charts.Add
With xlChart
    .ChartType = xl3DBarClustered
    .SetSourceData xlSheet.Cells(1, 1).CurrentRegion
    .PlotBy = xlColumns
    .Location _
     Where:=xlLocationAsObject, _
     Name:=conSheetName
End With

Setting the location loses the references, so you must retrieve a new reference to the Chart object. The chart is then formatted using the methods and properties of the Chart object:

With xlBook.ActiveChart
    .HasTitle = True
    .HasLegend = False
    With .ChartTitle
        .Characters.Text = conSheetName & " Chart"
        .Font.Size = 16
        .Shadow = True
        .Border.LineStyle = xlSolid
    End With
    With .ChartGroups(1)
        .GapWidth = 20
        .VaryByCategories = True
    End With
    .Axes(xlCategory).TickLabels.Font.Size = 8
    .Axes(xlCategoryScale).TickLabels.Font.Size = 8
End With

The worksheet and chart are then displayed by setting the Application object's Visible property to True:

xlApp.Visible = True

Finally, the cleanup code runs, shutting down all the objects that have been used and reclaiming memory:

rst.Close
Set rst = Nothing
Set xlSheet = Nothing
Set xlBook = Nothing
Set xlApp = Nothing

The examples shown here barely scratch the surface of the capabilities of Excel Automation. Excel has a complex object model that is very easy to get lost in!

If you can't figure out the proper syntax for working with an Excel Automation object, launch Excel and choose Tools Macro Record new macro from the menu, then record the actions that you are having problems with. Once you stop the macro recorder, you can examine the code that was created by pressing Alt-F11 and expanding the Modules node. You may then be able to figure out how to plug the code into your Access code.


    [ Team LiB ] Previous Section Next Section