| [ Team LiB ] |
|
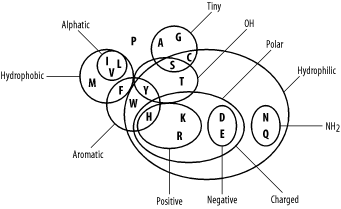
4.2 Amino Acid SimilarityMolecular biologists usually think of amino acid similarity in terms of chemical similarity (see Table 2-1). Figure 4-3 depicts a rough qualitative categorization. From an evolutionary standpoint, you expect mutations that radically change chemical properties to be rare because they may end up destroying the protein's three-dimensional structure. Conversely, changes between similar amino acids should happen relatively frequently. Figure 4-3. Amino acid chemical relationships In the late '60s and early '70s, Margaret Dayhoff pioneered quantitative techniques for measuring amino acid similarity. Using sequences that were available at the time, she constructed multiple alignments of related proteins and compared the frequencies of amino acid substitutions. As expected, there is quite a bit of variation in amino acid substitution frequency, and the patterns are generally what you'd expect from the chemical properties. For example, phenylalanine (F) is most frequently paired to itself. It is also found relatively frequently with tyrosine (Y) and tryptophan (W), which share similar aromatic ring structures (see Table 2-1), and to a lesser extent with the other hydrophobic amino acids (M, V, I, and L). Phenylalanine is infrequently paired with hydrophilic amino acids (R, K, D, E, and others). You can see some of these patterns in the following multiple alignment, which corresponds to a portion of the cytochrome b protein from various organisms. PGNPFATPLEILPEWYLYPVFQILRVLPNKLLGIACQGAIPLGLMMVPFIE PANPFATPLEILPEWYFYPVFQILRTVPNKLLGVLAMAAVPVGLLTVPFIE PANPMSTPAHIVPEWYFLPVYAILRSIPNKLGGVAAIGLVFVSLLALPFIN PANPLVTPPHIKPEWYFLFAYAILRSIPNKLGGVLALLFSILMLLLVPFLH PANPLSTPAHIKPEWYFLFAYAILRSIPNKLGGVLALLLSILVLIFIPMLQ PANPLSTPPHIKPEWYFLFAYAILRSIPNKLGGVLALLLSILILIFIPMLQ IANPMNTPTHIKPEWYFLFAYSILRAIPNKLGGVIGLVMSILIL..YIMIF ESDPMMSPVHIVPEWYFLFAYAILRAIPNKVLGVVSLFASILVL..VVFVL IVDTLKTSDKILPEWFFLYLFGFLKAIPDKFMGLFLMVILLFSL..FLFIL Dayhoff represented the similarity between amino acids as a log2 odds ratio, also known as a lod score. To derive the lod score of an amino acid, take the log2 of the ratio of a pairing's observed frequency divided by the pairing's random expected frequency. If the observed and expected frequencies are equal, the lod score is zero. A positive score indicates that a pair of letters is common, while a negative score indicates an unlikely pairing. The general formula for any pair of amino acids is shown in Figure 4-4. Figure 4-4. Equation 4-3The score of two amino acids i and j, is sij, their individual probabilities are pi and pj, and their frequency of pairing is qij. For example, suppose the frequencies of methionine (M) and leucine (L) in your data set are 0.01 and 0.1, respectively. By random pairing, you expect 1/1000 amino acid pairs to be M-L. If the observed frequency of pairing is 1/500, the odds ratio is 2/1. Converting this to a base 2 logarithm gives a lod score of +1, or 1 bit. Similarly, if the frequency of arginine (R) is 0.1 and its frequency of pairing with L is 1/500, the lod score of an R-L pair is -2.322 bits. In computers, using base e rather than base 2 is more convenient. The values of +1 and -2.322 bits are 0.6931 and -1.609 nats, respectively. If you know the direction of change from an evolutionary tree, the pair-wise scores can be asymmetric. That is, the score of M-L and L-M may not be equal. For simplicity, the direction of evolution is usually ignored, though, and the scores are symmetrical. |
| [ Team LiB ] |
|