| [ Team LiB ] |
|
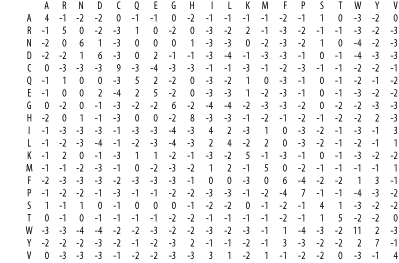
4.3 Scoring MatricesA two-dimensional matrix containing all possible pair-wise amino acid scores is called a scoring matrix. Scoring matrices are also called substitution matrices because the scores represent relative rates of evolutionary substitutions. Scoring matrices are evolution in a nutshell. Take a moment now to peruse the scoring matrix in Figure 4-5 and compare it to the chemical groupings in Figure 4-3. Figure 4-5. BLOSUM62 scoring matrix Lod scores are real numbers but are usually represented as integers in text files and computer programs. To retain precision, the scores are generally multiplied by some scaling factor before converting them to integers. For example, a lod score of -1.609 nats may be scaled by a factor of two and then rounded off to an integer value of -3. Scores that have been scaled and converted to integers have a unitless quantity and are called raw scores. 4.3.1 PAM and BLOSUM MatricesTwo different kinds of amino acid scoring matrices, PAM (Percent Accepted Mutation) and BLOSUM (BLOcks SUbstitution Matrix), are in wide use. The PAM matrices were created by Margaret Dayhoff and coworkers and are thus sometimes referred to as the Dayhoff matrices. These scoring matrices have a strong theoretical component and make a few evolutionary assumptions. The BLOSUM matrices, on the other hand, are more empirical and derive from a larger data set. Most researchers today prefer to use BLOSUM matrices because in silico experiments indicate that searches employing BLOSUM matrices have higher sensitivity. There are several PAM matrices, each one with a numeric suffix. The PAM1 matrix was constructed with a set of proteins that were all 85 percent or more identical to one another. The other matrices in the PAM set were then constructed by multiplying the PAM1 matrix by itself: 100 times for the PAM100; 160 times for the PAM160; and so on, in an attempt to model the course of sequence evolution. Though highly theoretical (and somewhat suspect), it is certainly a reasonable approach. There was little protein sequence data in the 1970s when these matrices were created, so this approach was a good way to extrapolate to larger distances. Protein databases contained many more sequences by the 1990s so a more empirical approach was possible. The BLOSUM matrices were constructed by extracting ungapped segments, or blocks, from a set of multiply aligned protein families, and then further clustering these blocks on the basis of their percent identity. The blocks used to derive the BLOSUM62 matrix, for example, all have at least 62 percent identity to some other member of the block. Why, then, are the BLOSUM matrices better than the PAM matrices with respect to BLAST? One possible answer is that the extrapolation employed in PAM matrices magnifies small errors in the mutation probabilities for short evolutionary time periods. Another possibility is that the forces governing sequence evolution over short evolutionary times are different from those shaping sequences over longer intervals, and you can't estimate distant substitution frequencies without alignments from distantly related proteins. |
| [ Team LiB ] |
|