Cross tabulation (cross-tab or X-tab for short) is a statistical report where data is displayed in a way that allows for easy comparison. The displayed data is usually aggregated, denormalized, and displayed within a matrix table where the headings of certain rows are data themselves.
Consider this table, which shows some data about certain items from a small electronics store.
|
Name |
Status |
Amount |
|---|---|---|
|
VCR player |
Damaged |
1 |
|
VCR player |
Sold |
10 |
|
Monitor |
Damaged |
3 |
|
Monitor |
Sold |
3 |
|
Mouse |
Damaged |
0 |
|
Mouse |
Sold |
1 |
|
Keyboard |
Damaged |
2 |
|
Keyboard |
Sold |
1 |
The table on the following page shows another way to display the same information.
|
Name |
Sold |
Damaged |
Total |
|---|---|---|---|
|
VCR player |
10 |
1 |
11 |
|
Monitor |
3 |
3 |
6 |
|
Mouse |
1 |
0 |
1 |
|
Keyboard |
1 |
2 |
3 |
|
Total |
15 |
6 |
21 |
The new table formatted as a cross-tab now displays the data in a more compact manner that allows for easier comparison. Notice that the Status column, which contains two discrete values (Sold, Damaged), has been replaced by the Sold and Damaged columns. In other words, the value from Status has been converted to columns. If Status had more values, the cross-tab would generate a column for each additional value. There is also a column and a row to show the total for each.
Many front-end tools provide advanced cross-tab capabilities. PivotTable in Excel is a good example. A problem, however, arises when you have a huge amount of data that you need to transfer. This tends to slow down the front end. The way around this is to do the cross-tab, or some of it, on the server. Very complex cross-tabs and statistical analysis can be achieved through the use of expensive statistical tools, such as online analytical processing (OLAP) tools available with the Enterprise Edition of Microsoft SQL Server 2000. However, this might be too expensive or overkill for what you need.
Let’s start with a simple example. If you look at the Employees table, you will notice that there are two distinct values for the Country field. These are “USA” and “UK.” Suppose that for each job title (Employees.Title), we want to know how many employees are from each country. This would be a simple matter of using COUNT and GROUP BY.
SELECT Employees.Title,
       Employees.Country,
       COUNT(1) as total
 FROM Employees
GROUP BY Employees.Title, Employees.Country
ORDER BY Employees.Title
The result is shown in Figure D-8:
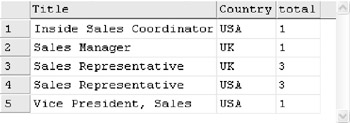
Though the result list is small, imagine for a minute that there are many more employees and many more titles; then the result set would be bigger and difficult to read. To overcome this, you can put USA and UK under their own column heading so that you end up with:
|
Title |
USA |
UK |
Total |
|---|---|---|---|
|
Inside Sales Coordinator |
1 |
0 |
1 |
|
Sales Manager |
0 |
1 |
1 |
|
Sales Representative |
3 |
3 |
6 |
|
Vice President, Sales |
1 |
0 |
1 |
|
<-- ALL --> |
5 |
4 |
9 |
To work the query out, it helps if you consider how you would do it manually.
For UK: You will only count a row if the country is UK.
Let’s now put this into a SQL query.
SELECT Employees.Title,
       SUM (CASE WHEN Employees.Country = 'USA' THEN 1
            ELSE 0 END) as USA,
       SUM (CASE WHEN Employees.Country = 'UK' THEN 1
            ELSE 0 END) as UK,
       COUNT(1) as total
  FROM Employees
GROUP BY Employees.Title
ORDER BY Employees.Title
Since Country is no longer a column in the SELECT but has been split into two columns, USA and UK, we must remove it from the GROUP BY clause. This query, however, does not have our grand total (<-- ALL -->). To generate it, we need to make use of ROLLUP, like we learned in the previous section. We also have to generate an extra column [Group No] to help with the ordering.
SELECT GROUPING(Employees.Title) as [Group No],
       CASE WHEN
         (GROUPING(Employees.Title) = 1)
       THEN '<-- ALL -->'
       ELSE
         ISNULL(Employees.Title, 'UNKNOWN')
       END AS Title,
       SUM (CASE WHEN Employees.Country = 'USA' THEN 1
            ELSE 0 END) as USA,
       SUM (CASE WHEN Employees.Country = 'UK' THEN 1
            ELSE 0 END) as UK,
       COUNT(1) as Total
 FROM Employees
GROUP BY Employees.Title WITH ROLLUP
ORDER BY [Group no], Employees.Title
The result is shown in Figure D-9.
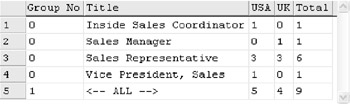
There is one problem, however. If we get an employee from another country, say for example, Seychelles (SEZ), we will have to recreate the script with an extra column. What if there are 20 more countries and 50 more different titles? It is not viable to create the columns one by one. There is something that we learned earlier that we can use: dynamic queries.
To demonstrate the power of dynamic queries, GROUP BY, and cross-tabs, let’s suppose we want to compare the sales value of every product against every employee to generate a product-employee cross-tab. We will do this through a stored procedure called [sp_Product_Employee_xtab].
The first design consideration is to choose which of the Product and Employee columns you want to split into separate columns. Since there are fewer employees than there are products, it is better to choose Employee so that we have fewer columns to build.
The general template of the SELECT in this case is:
SELECT GROUPING(ProductName) as [Group No],
  CASE WHEN (GROUPING(Products.ProductName) = 1)
  THEN '<-- ALL -->'
  ELSE
    ISNULL(Products.ProductName, 'UNKNOWN ')
  END AS [Product Name],
    <CASE WHEN for each Employee Name>
  SUM( [Order Details].UnitPrice *
    [Order Details].Quantity *
    (1 - [Order Details].Discount)
  ) as [Total Sale Value]
FROM Employees
  INNER JOIN Orders
    ON Employees.EmployeeID = Orders.EmployeeID
  INNER JOIN [Order Details]
    ON Orders.OrderID = [Order Details].OrderID
  INNER JOIN Products
    ON [Order Details].ProductID = Products.ProductID
  GROUP BY Products.ProductName WITH ROLLUP
  ORDER BY [Group No], Products.ProductName
The template for <CASE WHEN for each Employee Name> is shown in Listing D-15b.
SUM ( CASE WHEN Employees.EmployeeID = <@EmployeeID>
THEN ( [Order Details].UnitPrice *
       [Order Details].Quantity *
       (1 - [Order Details].Discount)
     )
ELSE
  0
END )as [<@EmployeeName>]
The templates can be generated into a string and the string executed using EXCUTE.
Now that we know the template for the SELECT statement, let’s go ahead and build sp_Product_Employee_xtab. First, we do the standard declarations.
/******************************************
Drop stored procedure if already exist    *
******************************************/
if exists
  (select * from sysobjects
    where id = object_id(N'sp_Product_Employee_xtab') and
    OBJECTPROPERTY(id, N'IsProcedure') = 1
  )
DROP procedure sp_Product_Employee_xtab
GO

CREATE procedure sp_Product_Employee_xtab
/******************************************
 Procedure:  sp_OrderAddProduct
 Date:       17 July 2002
 Author:     Ryan N. Payet
 Description:
        Generate Cross-tab to compare Sale Value
        of every product against every Employee

 Version History
 ---------------
 0.1, 17 July 2002, Ryan N. Payet:
      Procedure Created
******************************************/
AS
BEGIN

  /*Declare Variable for script*/
  DECLARE @@SQLTOPScript as nvarchar(4000)
  DECLARE @@SQLCOLScript  as nvarchar(4000)
  DECLARE @@SQLBOTTOMScript as nvarchar(4000)

  /*Declare Variable for employee*/
  DECLARE @@ID as integer
  DECLARE @@NAME as nvarchar(100)
Now we need to generate the <CASE WHEN for each Employee Name> part. To do this, we need to use a cursor that accesses the Employee table. Using the cursor, we can then loop through each row in the Employees table and generate the script.
  /*Declare cursor for Loop though Employees table */
  DECLARE Empoyee_Cursor CURSOR FOR
    SELECT EmployeeID,
        Employees.FirstName + ' ' + Employees.LastName as
        [Employee Name]
    FROM Employees ORDER BY [Employee Name]

  OPEN Employee_Cursor

  /*Get the first Employee*/
  FETCH NEXT FROM Employee_Cursor
  INTO @@ID,@@NAME
  SET @@SQLCOLScript = ''
  /*LOOP until end of cursor*/
  WHILE @@FETCH_STATUS = 0
  BEGIN
    /*Build Column list*/
    SET @@SQLCOLScript = @@SQLCOLScript + ',' + Char(13)
      + ' SUM ( CASE WHEN Employees.EmployeeID = '
      + CONVERT(nvarchar(10),@@ID)
      + ' THEN ( [Order Details].UnitPrice '
      + ' * [Order Details].Quantity * '
      + ' (1 - [Order Details].Discount) )'
      + ' ELSE 0 END)as [' + @@NAME + ']'
    /*Get next table name*/
    FETCH NEXT FROM Employee_Cursor
    INTO @@ID,@@NAME
  END

  /*CLEAN up CURSOR*/
  CLOSE Employee_Cursor
  DEALLOCATE Employee_Cursor
The final part is simple, and all that needs to be done is to generate the rest of the scripts, join them, and execute.
  /*Declare top part of query*/
  SET @@SQLTOPScript = ''
    + 'SELECT '
    + 'GROUPING(ProductName) as [Group No],' + Char(13)
    + ' CASE WHEN '
    + '(GROUPING(Products.ProductName) = 1)'
    + ' THEN ' + CHAR(39) + '<-- ALL -->' + CHAR(39)
    + ' ELSE'
    + ' ISNULL(Products.ProductName, '
    + CHAR(39) + 'UNKNOWN '+ CHAR(39) + ')'
    + 'END AS [Product Name]'
  /*Declare bottom part of query*/
  SET @@SQLBOTTOMScript = ',' + Char(13)
    + ' SUM( [Order Details].UnitPrice *'
    + ' [Order Details].Quantity *'
    + ' (1 - [Order Details].Discount)'
    + ' ) as [Total Sale Value] ' + Char(13)
    + 'FROM   Employees ' + Char(13)
    + '  INNER JOIN Orders ' + Char(13)
    + '    ON Employees.EmployeeID = Orders.EmployeeID '
      + Char(13)
    + '  INNER JOIN [Order Details] ' + Char(13)
    + '    ON Orders.OrderID = [Order Details].OrderID '
      + Char(13)
    + '  INNER JOIN Products' + Char(13)
    + '    ON [Order Details].ProductID
           = Products.ProductID' + Char(13)
    + ' GROUP BY Products.ProductName WITH ROLLUP '
      + Char(13)
    + ' ORDER BY [Group No], Products.ProductName  '
      + Char(13)

   EXECUTE ( @@SQLTOPScript + @@SQLCOLScript
           + @@SQLBOTTOMScript)

END

GO
Now that the stored procedure is done, all we have to do is excute it to get our cross-tab.
EXECUTE sp_Product_Employee_xtab
A sample of the result is shown in Figure D-10.
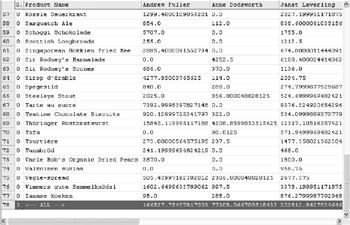
The stored procedure returns a result that is formatted as a cross-tab. If the number of employees increases, the number of columns will automatically be adjusted to accommodate the new employees.