| [ Team LiB ] |
|
8.3 Perform Controls, Especially in the Twilight ZoneControls are crucial to any scientific experiment. The random model underlying BLAST statistics provides one kind of control, but performing an explicit control can give you greater confidence in your results. This is especially true when looking for weak similarities, commonly called the twilight zone. One of the simplest and most effective ways to determine if an alignment is believable is to shuffle your query sequence and repeat the search. If the shuffled sequence returns similar results, the alignment is based on compositional biases or the search parameters aren't specific enough. The following Perl script shuffles a FASTA file: #!/usr/bin/perl -w
use strict;
my ($def, @seq) = <>;
print $def;
chomp @seq;
@seq = split(//, join("", @seq));
my $count = 0;
while (@seq) {
my $index = rand(@seq);
my $base = splice(@seq, $index, 1);
print $base;
print "\n" if ++$count % 60 == 0;
}
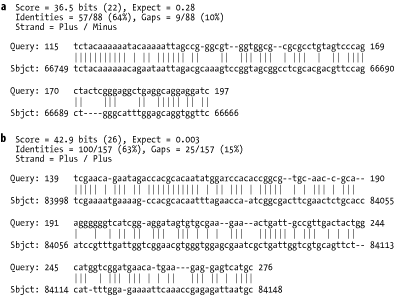
Now let's put this script into action. Let's make the dubious hypothesis that ALU repeats aren't specific to primates but are present in all genomes. They haven't been found because people just haven't looked hard enough. Your search parameters use +1/-1 match/mismatch scores and a gap opening cost of 1 and extension cost of 1. (WU-BLAST users would understand this as a cost of 2 for the first gap and 1 for each additional gap). Figure 8-1a shows an alignment between a human ALU (a variety of repeats are available from ftp://ftp.ncbi.nih.gov/repository/repbase) and the Caenorhabditis elegans genome (see http://www.wormbase.org). Without a control, you might be able to convince yourself that you found a match to a C. elegans ALU. However, because a shuffled control (Figure 8-1b) produces an alignment that is approximately 100 times more significant, this conclusion isn't very likely. Figure 8-1. Searching (a) an ALU element and (b) a shuffled version against the C. elegans genome You might wonder why the alignments in Figure 8-1 seem to have significant E-values. The search employed low gap penalties and ungapped alignment statistics. When using gapped alignment statistics, these alignments are expected at random. |
| [ Team LiB ] |
|