12.6 JavaScript Debugger
Dreamweaver
4 includes a JavaScript debugger that allows you to debug JS code,
but there are some caveats.
The debugger:
Requires NN4.5+ (Macintosh and Windows, but excluding NN6) or IE4+
(Windows only).
Requires that both Java and JavaScript be enabled in your
browser's preferences.
Will debug JS code embedded in HTML documents or stored in external
.js files.
Will not work in any version of IE on the Mac, in any version of NN6
on either platform, or in Opera.
Will not debug JS code when you use frames. You must debug each
framed HTML page separately.
Will not debug JS code in templates or documents attached to
templates. You must detach a document from its template before
debugging it.
May not work on the Macintosh if TCP/IP access is set to AppleTalk or
PPP. The workaround, as described in Macromedia TechNote 15020, is to
change the TCP/IP setting to connect via a different method.
May hinder system performance or interfere with other operations such
as viewing the Help files in the browser. Close the debugger when it
is no longer needed.
12.6.1 Running the Debugger
To run the debugger you must brave a slew of dialog boxes:
Open the HTML document you want to debug (you can't start the
debugger while editing as .js
file). Save any recent changes to the file.
With your HTML document open, select File  Debug in Browser Debug in Browser  browser.
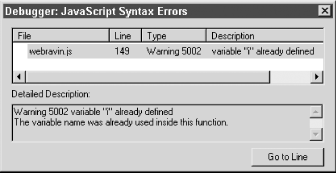
Dreamweaver checks your code for syntax errors and reports errors in
the JavaScript Syntax Errors dialog box shown in Figure 12-7.
If there are no syntax errors, Dreamweaver launches the debugger for
the chosen browser. If asked whether to start debugging, click OK.
Because the debugger itself is a Java applet, the browser displays an
ominous warning about potential security risks of network access (the
debugger connects with the browser but does not make any network
connections).
If using Internet Explorer, Click the Yes button in Internet
Explorer's Security Warning dialog box (not shown). You can
accept the Macromedia Security Certificate by clicking the Macromedia
Dreamweaver name in this dialog box and then clicking the Install
Certificate option. If asked whether to start debugging, click OK.
If using Netscape, click the Grant button in Netscape's Java
Security dialog box (not shown). Click the Remember This Decision
checkbox in that dialog box to avoid being asked again next time.
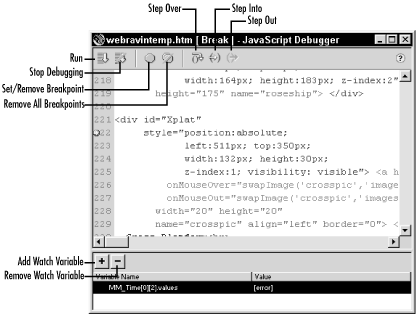
Finally, the JavaScript Debugger opens (see Figure 12-8).
Let's looks a little more carefully at some of the debugging
tools.
12.6.1.1 The JavaScript Syntax Errors dialog box
The JavaScript Syntax
Errors dialog box, shown in Figure 12-7, provides
the filename, line number, error type, and description for each
error. When you select an error from the list, the bottom of the
dialog provides a detailed description of the usual cause of such
errors. Use the Go To Line button (or simply double-click one of the
errors in the list) to find the corresponding line in the script
where you should fix the error.

12.6.1.2 The JavaScript Debugger window
Dreamweaver's debugger offers the
typical features needed to find and fix errors, such as the ability
to set breakpoints, watch variables, and step through your code. See
"Debugging JavaScript Code" in the online Help for a
quick overview, especially if you've never use a debugger
before. The JavaScript Debugger is shown in Figure 12-8. The lower pane (the Watcher) is used to
examine variables and change their values.

Here are some quick hints regarding the debugger:
Before starting a debugging session, you can set breakpoints in your
embedded scripts (those within your HTML file) or in external scripts
(those in .js files).
You'll be warned if you haven't set at least one
breakpoint before running the debugger.
Use the Run button in the debugger's toolbar to begin execution
or to continue execution until the next breakpoint is reached.
You'll often need to interact with the browser to trigger a
script. For example, if testing a rollover effect, you should roll
the mouse over the button of interest in the browser. Be sure to
place breakpoints where they'll actually be reached (setting a
breakpoint in a function that is never called won't help). When
a breakpoint is reached, the Debugger window should come to the
front.
The debugger may hinder system performance and prevent you from
viewing the online Help. Stop the debugger when it is no longer
needed.
If your browser doesn't respond, the debugger may be paused.
Use the Run button (F8) to resume execution. If nothing seems to
work, try quitting your browser and restarting the debugger.
Type javascript: on the Netscape
browser's command line to open its JavaScript console where you
can see error messages or test JS code. This console helps to solve
problems not apparent in Dreamweaver's debugger, such as when
the browser can't find a particular function in your JS code.
Table 12-6 summarizes the
debugging operations. To
set a breakpoint, click the line in your script at which to add the
breakpoint, and then click the Add/Remove Breakpoint icon.
 |
In Code view, you can use the Code Navigation menu (see Figure 12-6) to set breakpoints in a JS function or on the
line containing the HTML tag that calls the function. In the latter
case, once the breakpoint is reached, click the Step Into icon to
debug your JS function (you may need to click it more than once).
Breakpoints can also be set in the debugger itself.
|
|
To monitor a variable's value, highlight its name in the
debugger window and click the plus (+) button (see Figure 12-8). This adds the variable to the watch list.
You can also click the plus (+) button and type in the name of a
variable. You can change a variable's value in the Value column
of the watcher pane.
Table 12-6. Debugger command summary
|
Debug in primary browser
|
File  Debug in Browser Debug in Browser  browser1
|
Alt+F12
|
Opt+F12
|
|
Debug in secondary browser
|
File  Debug in Browser Debug in Browser  browser2
|
Ctrl+Alt+F12
|
Cmd+Opt+F12
|
|
Run (continue to next breakpoint)
|
Run icon
|
F8
|
F8
|
|
Close debugger
|
Stop Debugging icon
|
Alt+F4
|
Close box
|
|
Add/Remove breakpoint
|
Edit  Set/Remove Breakpoint or icon Set/Remove Breakpoint or icon
|
F7 or Ctrl+Alt+B
|
F7 or Cmd+Opt+B
|
|
Clear all breakpoints
|
Edit  Remove All Breakpoints or icon Remove All Breakpoints or icon
|
Alt+E, V
|
N/A
|
|
Step over a function
|
Step Over icon
|
F9
|
F9
|
|
Step into a function
|
Step Into icon
|
F10
|
F10
|
|
Step out of a function
|
Step Out icon
|
F11
|
F11
|
|
Watch variable
|
Plus (+) button in lower pane
|
N/A
|
N/A
|
|
Remove watched variable
|
Minus (-) button in lower pane
|
N/A
|
N/A
|
|

