|
|
< Day Day Up > |
|
Recipe 5.3 Starting a Debugging Session5.3.1 ProblemYour code isn't running as you want it to, and it's time to debug. 5.3.2 SolutionStart a new debugging session with the items in the Run menu. Then use the various debugging options, such as single-stepping, setting breakpoints, and more. 5.3.3 DiscussionSay you want your code to display this output: 3... 2... 1... Houston, we have liftoff. Your first attempt at the code might look like that shown in Example 5-3, in the class DebugClass in an application named DebugApp. Example 5-3. The DebugApp examplepackage org.cookbook.ch05;
public class DebugClass
{
public static void main(String[] args)
{
for(int loopIndex = 3; loopIndex > 0; loopIndex--)
{
System.out.println(loopIndex + "...");
if(loopIndex == 0)
{
System.out.println("Houston, we have liftoff.");
}
}
}
}Unfortunately, the code in Example 5-3 gives you this result: 3... 2... 1... It's time to debug. To start a debugging session, use one of the following items in the Run menu:
To start debugging the code in DebugApp, select
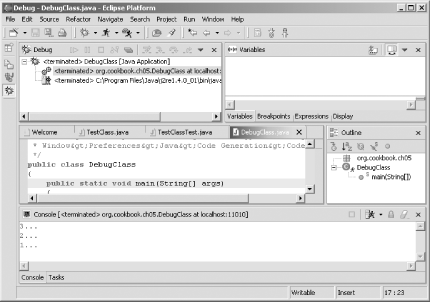
Run Figure 5-8. First attempt at debugging Take a look at the Debug perspective in Figure 5-8. You can see entries for the program(s) you're debugging in the Debug view at upper left. Next to the word Debug in the Debug view are five buttons. The names of the buttons are, from left to right, Resume (start executing code again), Suspend (pause code, as when you've got a runaway infinite loop), Terminate (stop debugging), Disconnect (disconnect from the debug session), and Remove All Terminated Launches.
To the right of the Debug view is a set of stacked views: Variables, Breakpoints, Expressions, and Display. The Debug perspective's Variables view enables you to examine the value of local variables. You can edit these values (which we'll do later in this chapter) as you debug your code. In this way, you can edit what's going on in your program interactively.
The Debug perspective's Breakpoints view enables you to manage breakpoints in your code by right-clicking them in the list and selecting Disable, Enable, Remove, or Remove All from the context menu. The Debug perspective's Expressions view enables you to evaluate expressions, as discussed in Recipe 5.12 . When you right-click an expression in the editor, and then click Inspect, the expression is evaluated in the Expressions view. Similarly, when you click Display on the context menu, the results appear in the Display view. The editor under the Debug perspective is much like the JDT editor; you can examine the values of elements simply by hovering your mouse over those elements. Next to the editor is the Outline view, as shown in Figure 5-8, which is the same as the Outline view in the Java perspective. Below the editor is the standard Console view, which, like its counterpart in the Java perspective, displays program output. Figure 5-8 shows that the code has run and terminated with the same results as before, without displaying the expected Houston, we have liftoff. message. To watch the program as it executes, take a look at Recipe 5.4 on setting breakpoints.
5.3.3.1 Eclipse 3.0Eclipse 3.0 also adds a Run 5.3.4 See AlsoRecipe 5.12 on evaluating expressions; Recipe 5.4 on setting a breakpoint; Recipe 5.5 on stepping through code; Chapter 3 of Eclipse (O'Reilly). |
|
|
< Day Day Up > |
|