| [ Team LiB ] |
|
10.2 DebuggingDebugging is the process of locating and eliminating errors in an application. Each error falls into one of three categories:
Both types of semantic errors are most typically the target of debugging efforts, since syntax errors are fairly easy to fix once they are identified by the compiler. Two main tools are useful for debugging ASP.NET applications: the ASP.NET trace feature (discussed later in this chapter) and debuggers. Two debuggers are of primary interest to ASP.NET developers: the .NET Framework SDK debugger, which has the substantial advantage of being free, and the Visual Studio .NET debugger, which provides additional debugging features such as remote debugging and the ability to debug native Win32 applications. An important limitation of the SDK debugger is that you cannot use it to edit source files, so you need to use another editor to make changes as you debug. The debugger in Visual Studio .NET allows you to edit your source files (although you need to stop debugging before editing and rebuild the application before restarting the debugger). To start a debugging session with either debugger, follow these basic steps:
The key to debugging in either debugger is ensuring that all code to be debugged is compiled in debug mode. This mode inserts symbols into the compiled assemblies that allow the debuggers to attach to the running code and allows you to step through this code line by line. In the next two sections we'll look at the specific steps taken to enable debug mode, start debugging sessions, and step through code in both debuggers. 10.2.1 Using the SDK DebuggerDebugging in the SDK debugger, DbgCLR.exe, is fairly straightforward. The program is located by default in the \FrameworkSDK\GuiDebug folder of either the Visual Studio .NET or .NET Framework install folder. Start by opening the debugger by double-clicking on its executable. The resulting window should look similar to Figure 10-2. Figure 10-2. The .NET Framework SDK debugger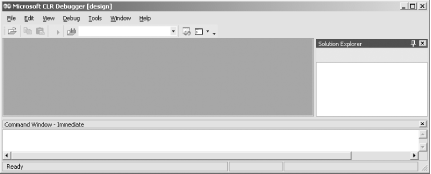 Now open the ASP.NET pages, code-behind files, and associated class files (for custom server controls, for example) that you wish to debug, using either the File Open File... menu command, or by clicking the Open File button on the toolbar. Before you go any further, you should ensure that debugging is enabled for all of the pages and class files you've opened. For code contained in ASP.NET pages, enabling it is simple: just add the Debug attribute to the @ Page directive and set its value to True: <%@ Page Language="VB" Debug="True" %> This step will also enable debugging of code contained within a code-behind file that is referenced by the Src attribute of the @ Page directive, which is compiled dynamically the first time the page is requested.
For code contained within precompiled code-behind files or other precompiled assemblies, you must compile the assembly with the compiler's debug flag set to enable debugging. Once you've ensured that all your code is ready for debugging, it's time to set a breakpoint. The easiest way to do this is to click in the lefthand margin next to the line of code at which you want the debugger to halt execution. Note that you can set breakpoints only on executable lines of code or procedure declarations. The result will look similar to Figure 10-3. Figure 10-3. Setting a breakpoint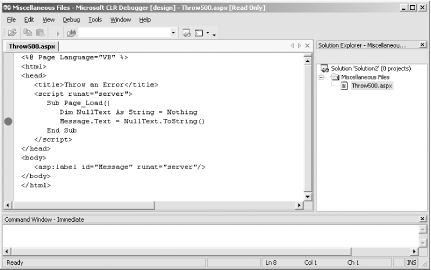 Once you've set your breakpoint, you'll need to open the desired page in Internet Explorer to start the processes to which the debugger will be attached. Once that's done, you can attach the debugger to the necessary processes by selecting Processes... from the Debug menu. This will open the Processes dialog. Select the aspnet_wp.exe process, and then click Attach... Next, locate the Internet Explorer process that corresponds to the page you loaded earlier, and attach that as well. At this point, the Processes dialog should look similar to Figure 10-4. Figure 10-4. Processes dialog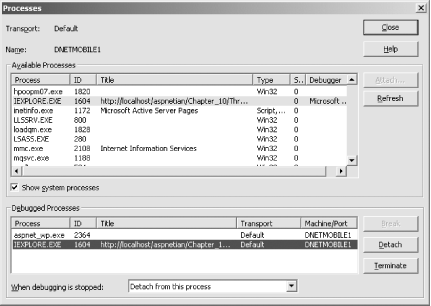 Now simply refresh the page in the browser, and assuming that the line on which you set the breakpoint is in the current flow of the application, the debugger should halt execution at the breakpoint, as shown in Figure 10-5. Then you can view the value of local variables using the Locals window (shown in Figure 10-5) or take advantage of other debugger features to examine your code. Figure 10-5. Halting on a breakpoint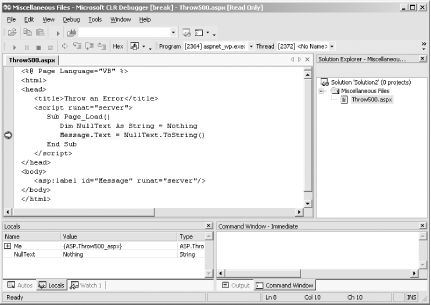 Once program execution has halted at a breakpoint, you can also step through your code line by line using the Step Into, Step Over, and Step Out commands in the Debug menu (or their keyboard shortcuts). This allows you to examine the value of variables as you walk through your code, as well as better determine exactly where a given error is occurring.
In addition to setting breakpoints by clicking in the left margin, you can use the New Breakpoint dialog to set conditional breakpoints (i.e., breakpoints that only halt execution every x number of times they're hit). To open the New Breakpoint dialog, select New Breakpoint... from the Debug menu. The dialog appears in Figure 10-6. Figure 10-6. New Breakpoint dialog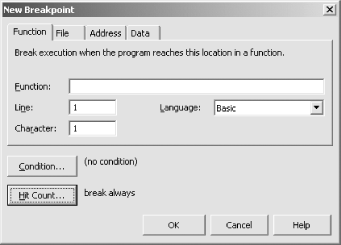 10.2.2 Using the Visual Studio .NET DebuggerGetting started with debugging in the Visual Studio .NET environment is simpler than with the SDK debugger, even though more debugging options and features are available, because projects are set up by default to support debugging. Assemblies generated for code-behind files in Visual Studio will be compiled in debug mode unless you explicitly tell the IDE to compile them in Release mode. Thus, as long as all of your code is in code-behind, you don't need to do anything further to enable debugging. If you have a mix of code within server-side <script> blocks in your .aspx files and code-behind pages, you'll still need to add the Debug attribute to your .aspx files as described in the previous section. To start debugging in Visual Studio .NET, open the project you want to debug, and then open the page (or pages), code-behind file(s), and/or class file(s) you want to debug. Because the Visual Studio .NET debugger can automatically attach itself to the correct processes when you want to start debugging, you don't need to explicitly attach the processes as described in the previous section (although you can still do it that way if you want to). However, in order to automatically attach the processes, you need to provide a starting point, which should be the first page you want to debug. Simply right-click that page in the Solution Explorer window and select Set As Start Page. Next, set breakpoints as desired in your code-behind or class files. Setting breakpoints is done the same way in the Visual Studio .NET debugger and the SDK debugger (which is discussed in the previous section). Once all your breakpoints are set, start debugging by selecting Start from the Debug menu. This should result in a new browser window being opened to the page that you set as the start page and the first breakpoint being hit. At this point, the IDE should look similar to Figure 10-7. Figure 10-7. Debugging in Visual Studio .NET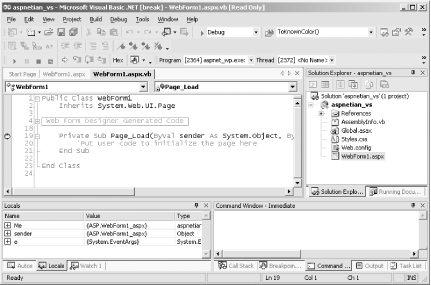 Now you can walk through your code or examine local variables the way you can in the SDK debugger. |
| [ Team LiB ] |
|