|
|
< Day Day Up > |
|
Recipe 5.4 Setting a Breakpoint5.4.1 ProblemYou need to watch your code while it's executing to pinpoint a problem. 5.4.2 SolutionSet a breakpoint and start a debug session, which executes your code until the breakpoint is encountered. When execution halts, you can see what's going on as your code executes. 5.4.3 DiscussionBreakpoints give you the chance to stop your code and take a look
around as your program runs. To set a breakpoint
in the JDT editor, double-click the
marker bar next to the line of executable code to which you want to
add a breakpoint (alternatively, highlight the line and select
Run To see how this works, we'll set a breakpoint in the code we've been developing: public class DebugClass
{
public static void main(String[] args)
{
for(int loopIndex = 3; loopIndex > 0; loopIndex--)
{
System.out.println(loopIndex + "...");
if(loopIndex == 0)
{
System.out.println("Houston, we have liftoff.");
}
}
}
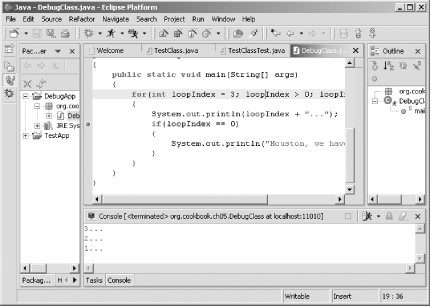
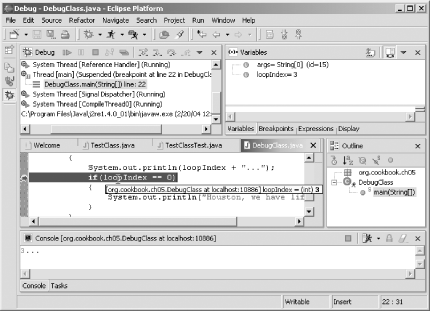
}The breakpoint icon (in the shape of a small circle) appears to the left of this line in the JDT editor, as shown in Figure 5-9. Figure 5-9. A new breakpoint Now select Run Figure 5-10. Halting at a breakpoint Letting the cursor rest on top of the loopIndex variable, as shown in Figure 5-10, indicates that the variable holds the value 3, which is appropriate for the beginning of the loop in the code. So, what do you do from here? You can step through your code, watching it being executed. See Recipe 5.5 for more details.
5.4.3.1 Eclipse 3.0In Eclipse 3.0, you can set breakpoints in external source
codethat is, source code that is not on the build
path of a Java project. The debugger's display in
Eclipse 3.0 features a number of other improvements as well; for
example, in Eclipse 3.0, the debugger uses invented names such as
arg1, arg2, and so on, to stand
for method parameter variables when the real names are not available
in compiled code. This version also offers new annotations for
highlighting the current instruction pointer and frames in the
execution call stack (which you can configure by selecting
Window 5.4.4 See AlsoRecipe 5.3 on starting a debugging session; Recipe 5.5 on stepping through code; Chapter 3 of Eclipse (O'Reilly). |
|
|
< Day Day Up > |
|